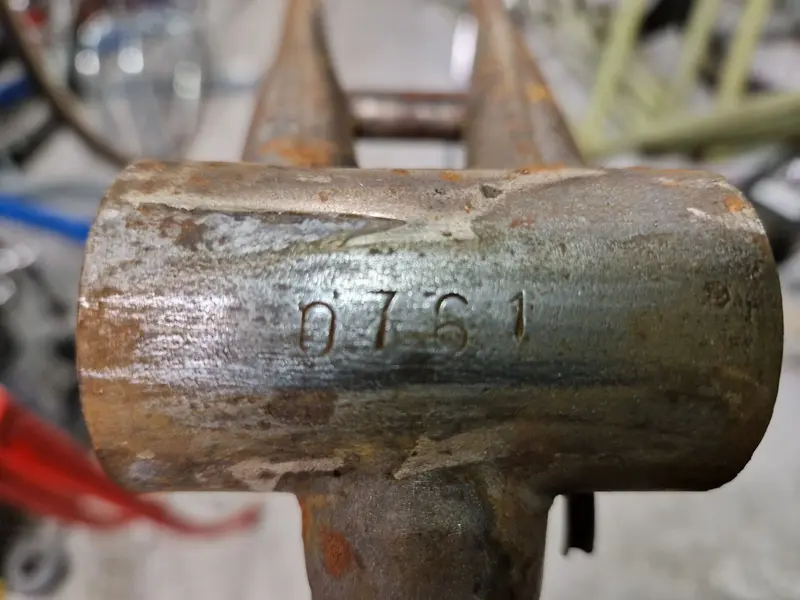
Thanks, I have to say I started by assuming the two systems didn't coexist and it was a clean switch over and back again. But, nothing ever seems to be that simple and I guess the honest answer is, we will never really know. I think it would be fair to assume it was a fairly clean switch over to the 4D system as we have some good documented frame numbers for late 1961 along with the batch of numbers issued to the shop. But the fact that we have 4D numbers up in the 6000's when factory production (for Holdsworth models) was around 1500/yr is a bit problematic. Added to this we have some CB numbers in there too and far fewer high numbers than lower numbers.
We do have a couple of documented 5D numbers for 1963 on wards, a Golden Hurricane from 64 and CBGuys very good number for 65. So I have allocated 1500 4D numbers for 1962 and reintroduced the 5D in 1963. This then has the rest of the known 4D running out at 1500/yr and a constant rise in 5D numbers over the period with the brake for one year. We do have problems with 4D numbers as there are an number of these; we have the 60's group, the 70's and it would seem a few from the shop too along with the original 5D numbers from the 40's. As I am sure you can appreciate here are distinct model differences in these groups. The 4D numbers did originally, and still do, include numbers we could not place so there is still an element of doubt here. It does look like the 60 group continued to be used after the change back to 5D for some reason and are probably not main stream factory production. These could be contract build for other companies or shops, built off site etc.
We do have a capacity issue in early 60's with the prediction as we have main stream factory production on 5D Holdsworths and CB's combined which is in excess of 1500/yr; that is to be expected. But I have then allocated 1500/yr 4D numbers in the early 60's too which can't really work unless the Holdsworth 5D numbers are low (as they seem to be), but if you allocated less the 4D group lasts longer, so we don't really know what the full production of frames was at this time and how it was split.
The problem with a prediction is that it is based on some known points and then a roughly linier or at least consistent rise in the numbers. Consequently the only thing we can be sure of is that it is a prediction and not reality, i.e. not 100% accurate. It is as you say a guide that is more accurate around the known points and less so else where. This is why I have included the Red, Yellow Green numbers to indicate quality of the data. The black numbers are just fitted in where I think they should go. Bit of a long explanation and if other have any more in site I would be pleased to hear it and put it along side what we have so far.
